The owner overview
One page with the month's or year's key figures — revenue, EBITDA, result, operating cash flow, cash, debt — against last year and budget, three trends and what to look at.
The Overview is a one-page summary for owners and managers: the key figures of one month or of the year to date, compared with last year and the budget, with the trends and the points to look at. It uses exactly the figures of the monthly board pack, so the page and the pack always agree.
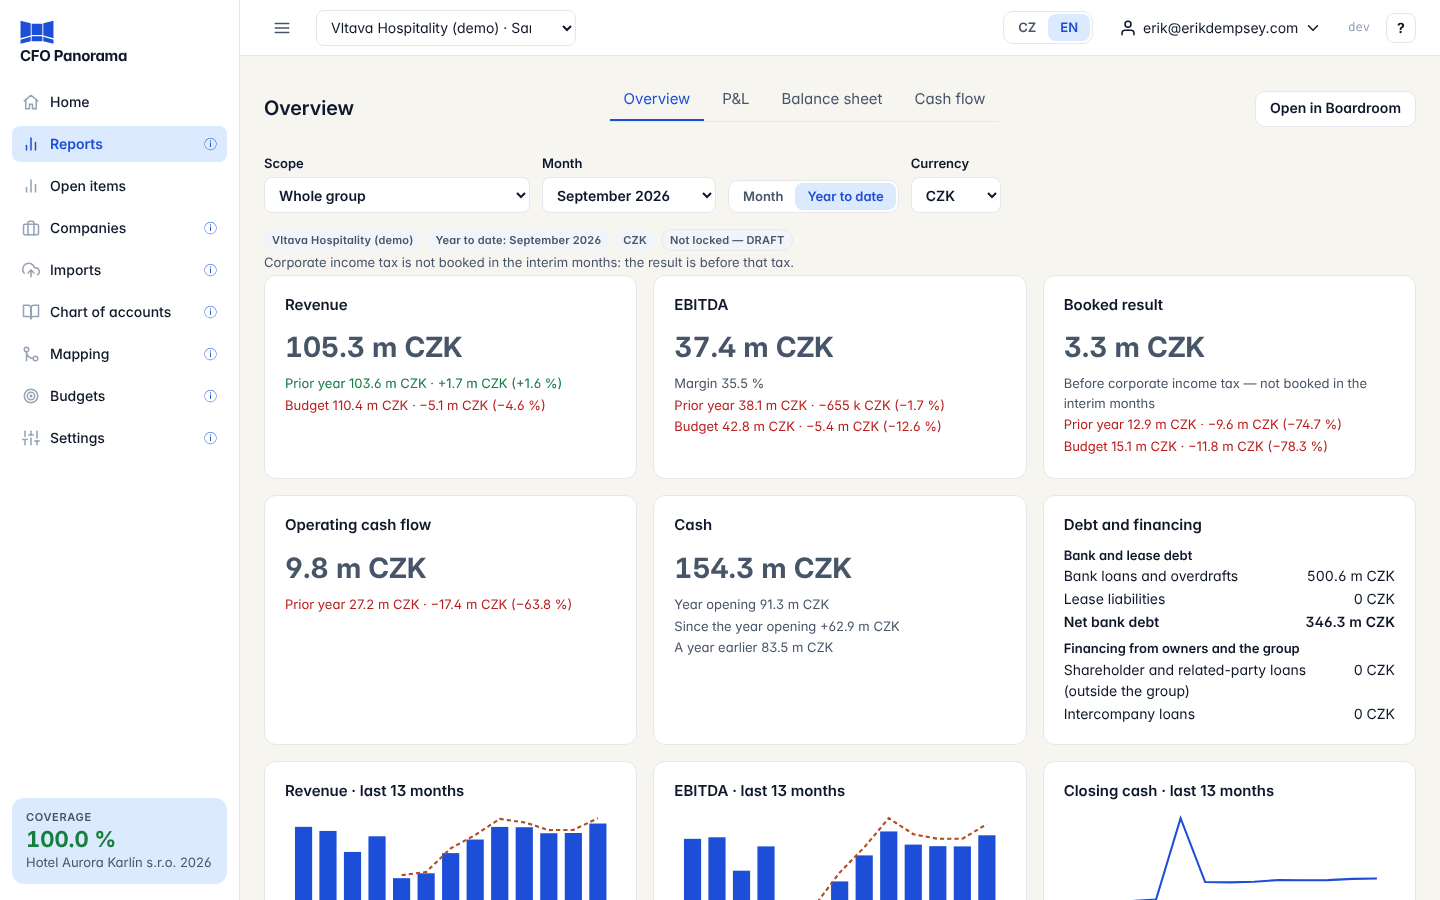
Open it from the Overview tab on the Reports page, or from the overview tile on the Home dashboard.
Choosing what to see
At the top of the page:
- Scope — Whole group, one company or a saved scope.
- Month — any month with data, latest first.
- Month | Year to date — the month alone or the fiscal year up to that month.
- Currency — when the group reports in more than one currency.
The page opens on the selection of your last report. If that report showed a hand-picked set of companies (not the whole group, one company or a saved scope), the overview shows the whole group and says so.
Below the choices, chips repeat the scope, the period (for example Year to date: September 2026), the currency and the lock state — Not locked — DRAFT when the month is not locked yet. A line under them states the tax basis, for example that corporate income tax is not booked in the interim months, so the result is before that tax.
The figure cards
| Card | What it shows |
|---|---|
| Revenue | Revenue, with Prior year and Budget and the difference in amount and %. |
| EBITDA | EBITDA and its Margin, against prior year and budget. |
| Booked result | The result as booked, with its tax basis, against prior year and budget. |
| Operating cash flow | Cash flow from operations, against prior year. |
| Cash | Cash at the end of the period, Year opening, the movement Since the year opening and A year earlier. |
| Debt and financing | Bank and lease debt (bank loans and overdrafts, lease liabilities, Net bank debt) and Financing from owners and the group (shareholder and related-party loans from outside the group, intercompany loans). |
A difference is green when it is favourable and red when it is not. Without an approved budget the card says no budget figure — never zero.
Trends
Three small charts over the last 13 months: Revenue and EBITDA as columns, with the budget as a dashed line where there is one, and Closing cash as a line. Budgets cover the P&L only, so cash has no budget line.
What to look at
Up to three findings from the board pack's rules — for example Net bank debt 6.6× LTM EBITDA — each with the question to ask and the Proposed owner. Once management has answered the board pack's questions workbook, the answer's owner, due date and status (open, answered, closed) appear here too. If no rule fired, the page says so.
The footer lists the evidence: the number of import batches and the latest export date, the mapping coverage of the P&L and the balance sheet, and the tax basis.
Going further
- The tabs P&L, Balance sheet and Cash flow at the top open the full statement of the same scope, period and currency — the cards reconcile to it. A ← Back to the overview button takes you back.
- Open in Boardroom opens the same selection as a presentation for a meeting. See Boardroom.
Good to know
- Nothing on this page is calculated separately: every figure is one of the board pack's figures, from the same report engine as the statements.
- The page is kept for up to 15 minutes and rebuilt at once when new data, mappings, journals or rates arrive.
- The overview is available where the group's plan includes the board pack.
Did not find what you need? Write to erik@cfopanorama.com.