Hotel statistics and USALI
The USALI operational P&L for hotels, the hotel statistics and KPIs (occupancy, ADR, RevPAR, TRevPAR, GOPPAR), restaurant covers and spend, and how statistics are uploaded.
On this page
Hotels compare themselves by the industry's own measures: departmental results, gross operating profit and room KPIs. CFO Panorama shows them on an operational P&L in the USALI format, next to the statistics you upload, so every KPI links accounting figures and operating figures for the same months.
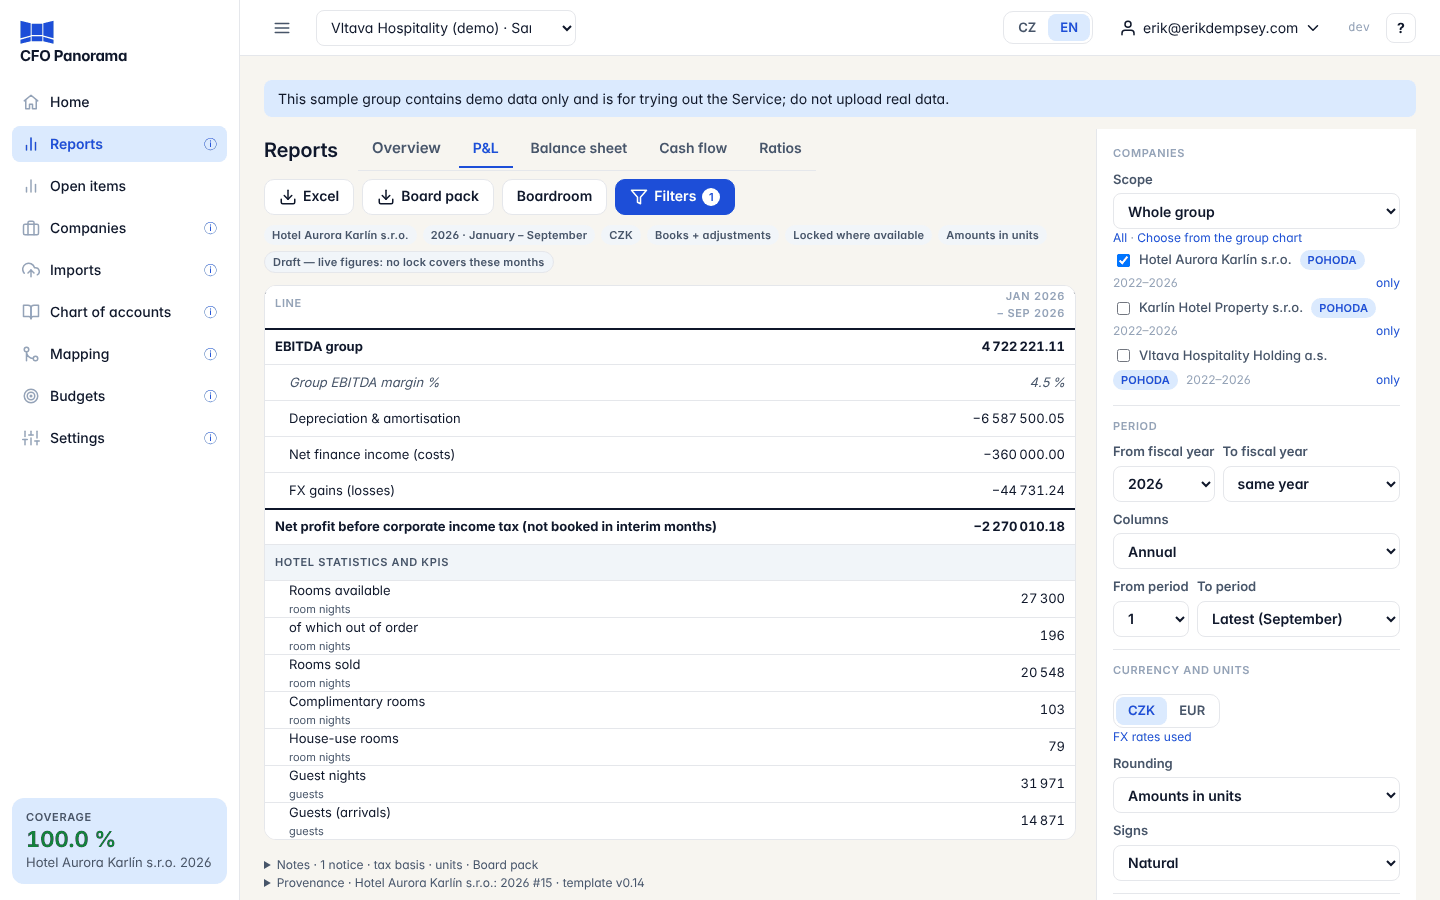
The USALI P&L
USALI, the Uniform System of Accounts for the Lodging Industry, is the hotel industry's standard P&L. Choose P&L — operational (USALI) under Filters → Display → Layout on the P&L tab.
| Block | Lines |
|---|---|
| Departmental | Rooms revenue, Food & beverage revenue, Other operated departments revenue, other revenue; the matching departmental expenses; Total departmental profit and its margin. |
| Undistributed | Administration & general, Marketing & distribution, Utilities, Property operations & maintenance. |
| GOP | EBITDA operations (GOP) and the GOP margin %. |
| Below GOP | Insurance & property taxes, HQ costs and management fees, EBITDA group, depreciation, finance and FX, and the result. |
The USALI layout reads the same mapped books as the P&L by nature; it only groups them by department, using the departments your cost centres are mapped to.
Hotel statistics and KPIs
Under the P&L lines, Hotel statistics and KPIs shows:
- Statistics — Rooms available (of which out of order), Rooms sold, Complimentary rooms, House-use rooms, Guest nights, Guests (arrivals) and F&B covers.
- KPIs — calculated from the P&L and the statistics of the same column:
| KPI | Calculation |
|---|---|
| Occupancy % | Rooms sold / rooms available |
| Average daily rate (ADR) | Rooms revenue / rooms sold |
| RevPAR | Rooms revenue / rooms available |
| Total revenue per available room (TRevPAR) | Total revenues / rooms available |
| GOP per available room (GOPPAR) | GOP / rooms available |
| Rooms cost per occupied room (CPOR) | Rooms expense / rooms sold |
| F&B revenue per cover | Food & beverage revenue / covers |
Where the statistics include the rooms revenue reported by the PMS, the layout also compares it with the rooms revenue in the books.
Each statistic and KPI carries its own unit beside its name (room nights, guests, CZK per available room) and is never rounded to thousands. A statistic that is a month-end state, such as the number of rooms, shows the last month of a column rather than a sum.
By hotel
For a company with several hotels, choose Split columns by → Hotel under Filters → Dimensions: you get one column per hotel, with its own occupancy, ADR, RevPAR and GOPPAR.
Restaurants
A restaurant group has its own layout, Restaurant management P&L, with Restaurant statistics below it: Guest visits (dine-in covers), Net dine-in spend per guest and Beverage share of dine-in sales, next to the gross margin and labour % of revenue.
Uploading statistics
Admins and editors upload statistics on the Upload page, as Excel only:
- On the Upload page, under Statistics template, choose the company and the fiscal year and click Download statistics template.
- Fill in the yellow cells: one row per measure and hotel, one column per month.
- Drop the workbook on the Upload page, one company per upload. A hotel can also upload the PMS statistics template.
A new upload replaces the figures of the same company, hotel, month and measure. Each upload has its own page under Imports. See Uploading files.
Good to know
- Months without statistics. If statistics are missing, the statistics lines are empty and the KPIs show not available (point at it to see which statistic is missing); a notice names the hotel and the months.
- Drill-down. Click a statistic to see the uploaded rows and the upload batch it came from (Drill-down).
- Board pack. The monthly board pack of a hotel group includes a hotel KPI slide and, if you choose, the USALI operating statement.
Did not find what you need? Write to erik@cfopanorama.com.