Dimensions
Map each company's cost centres (střediska), activities (činnosti) and jobs (zakázky) to the group's dimensions — department, hotel, business unit, project — and use them to filter reports or split their columns.
On this page
In POHODA and Money S3 postings can carry a cost centre (středisko), an activity (činnost) and a job (zakázka). Each company names them its own way. Dimension mapping links them to the group's own dimensions — such as department, hotel, business unit or project — so that every company's figures can be filtered and split by the same values. Admins and editors map; open the page from the company's page or its Account mapping.
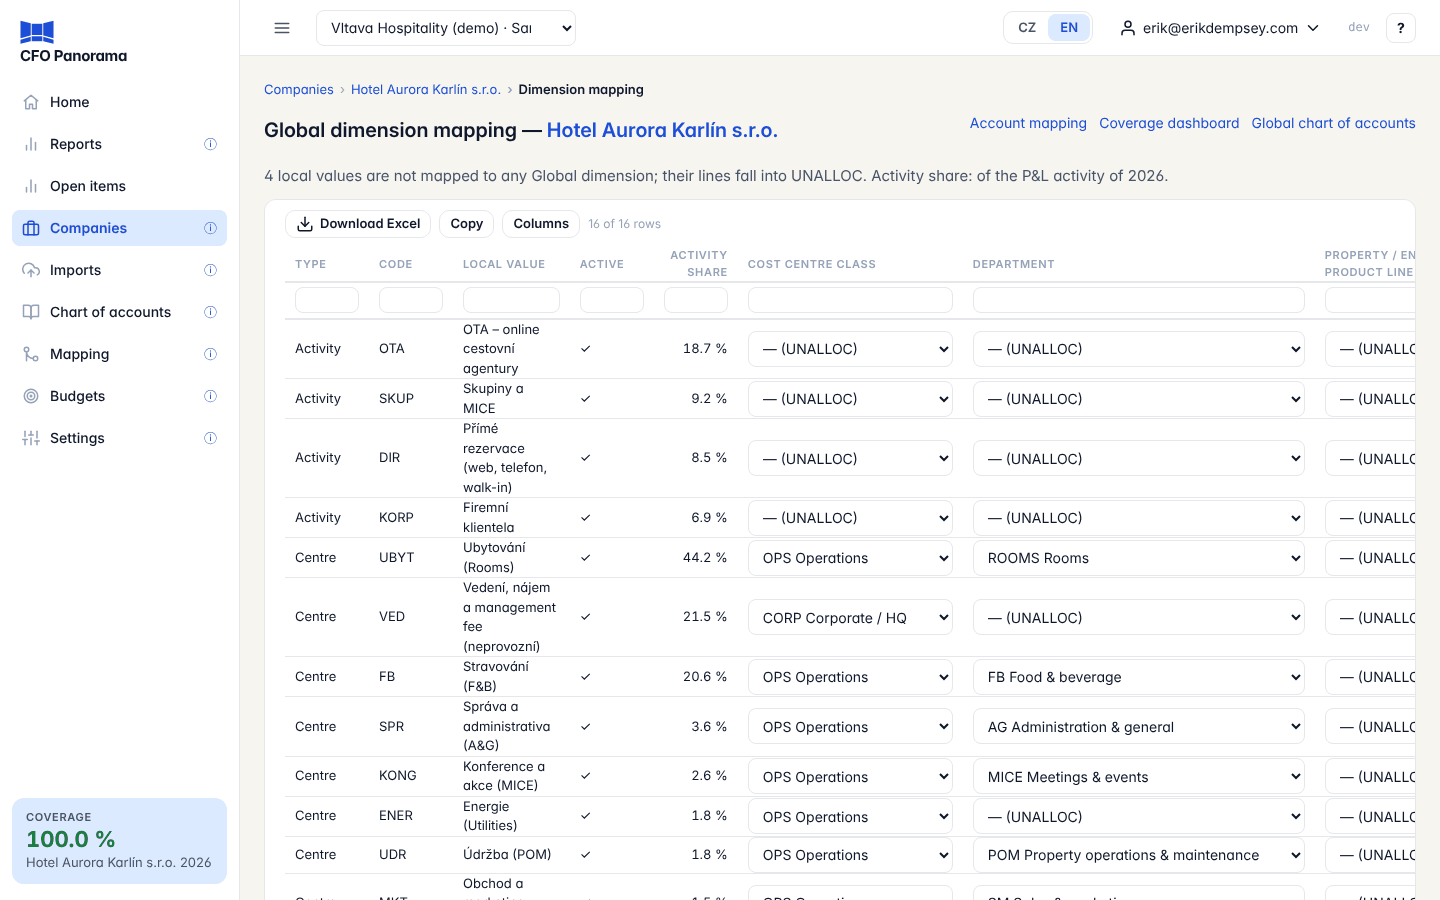
Local values and Global dimensions
- Local values arrive with the files: the journal brings the codes used on postings, the lists bring their names. Upload the střediska, činnosti and zakázky lists so the values have names (see Uploading files).
- Global dimensions are defined once for the group and listed on the Chart of accounts page under Reference data → Global dimensions (see Chart of accounts). Which ones a group has depends on its industry, for example:
| Global dimension | Typical values |
|---|---|
| Cost-centre class | Operations, Corporate / HQ, Development |
| Department | Rooms, Food & beverage, Meetings & events, Spa, Administration & general, Sales & marketing, Property operations & maintenance |
| Hotel | One value per hotel of the group |
| Business unit | Your properties, entities or product lines |
| Project | Your development projects |
| Campus, programme | One value per school site; kindergarten, primary, high school (education groups) |
The Dimension mapping page
The line at the top says how many local values are not mapped to any dimension yet; their lines fall into UNALLOC (unallocated). The table lists every local value of the company, the unmapped ones first:
| Column | Meaning |
|---|---|
| Type | Centre, Activity or Contract (job). |
| Code, Local value | The value as the accounting system has it. |
| Active | Whether it is still in the company's latest list. |
| Activity share | Its share of the company's P&L activity in the latest fiscal year — map the large ones first. |
| one column per Global dimension | The value it maps to, or — (UNALLOC). |
How to map
- Choose a value in each dimension column that applies. A cost centre can map to several dimensions at once — for example department Rooms and hotel Aurora.
- Click Save mappings. The message says how many mappings changed.
Mappings apply to all reports at once; nothing is re-imported. In the demo groups the page is read-only.
Which value a posting takes
A posting may carry a cost centre, an activity and a job. For each Global dimension the platform takes the cost centre's mapping first, then the activity's, then the job's. A posting whose values map to nothing in a dimension is shown as UNALLOC in that dimension, so the totals always add up.
Using dimensions in reports
In Reports, the Dimensions section of Filters offers:
- Filter dimension and Filter values — show only the figures of, say, one hotel or two departments;
- Split columns by — one column per value of a dimension, for example a P&L with a column for each hotel and one for UNALLOC.
Dimensions work on the P&L and the balance sheet. The cash flow and the ratios are always shown whole: cash is not booked by cost centre, and a partial cash flow would not tie.
Some report lines read a dimension themselves — the departments of a hotel's operating statement, for example. Hotel and campus statistics are also attached to their hotel or campus through the cost centres mapped to it, so map those cost centres before you upload statistics.
How complete is it?
The company's coverage dashboard has a Dimensions table: the share of P&L activity that carries a centre, activity or job, and for each Global dimension the share whose local values are mapped. See Account mapping and coverage.
Did not find what you need? Write to erik@cfopanorama.com.