The Home dashboard
What each card on Home shows — the period, a spotlight ratio, the issues on your radar, the six report tiles, cash movement and shortcuts — and how each link opens the matching report.
On this page
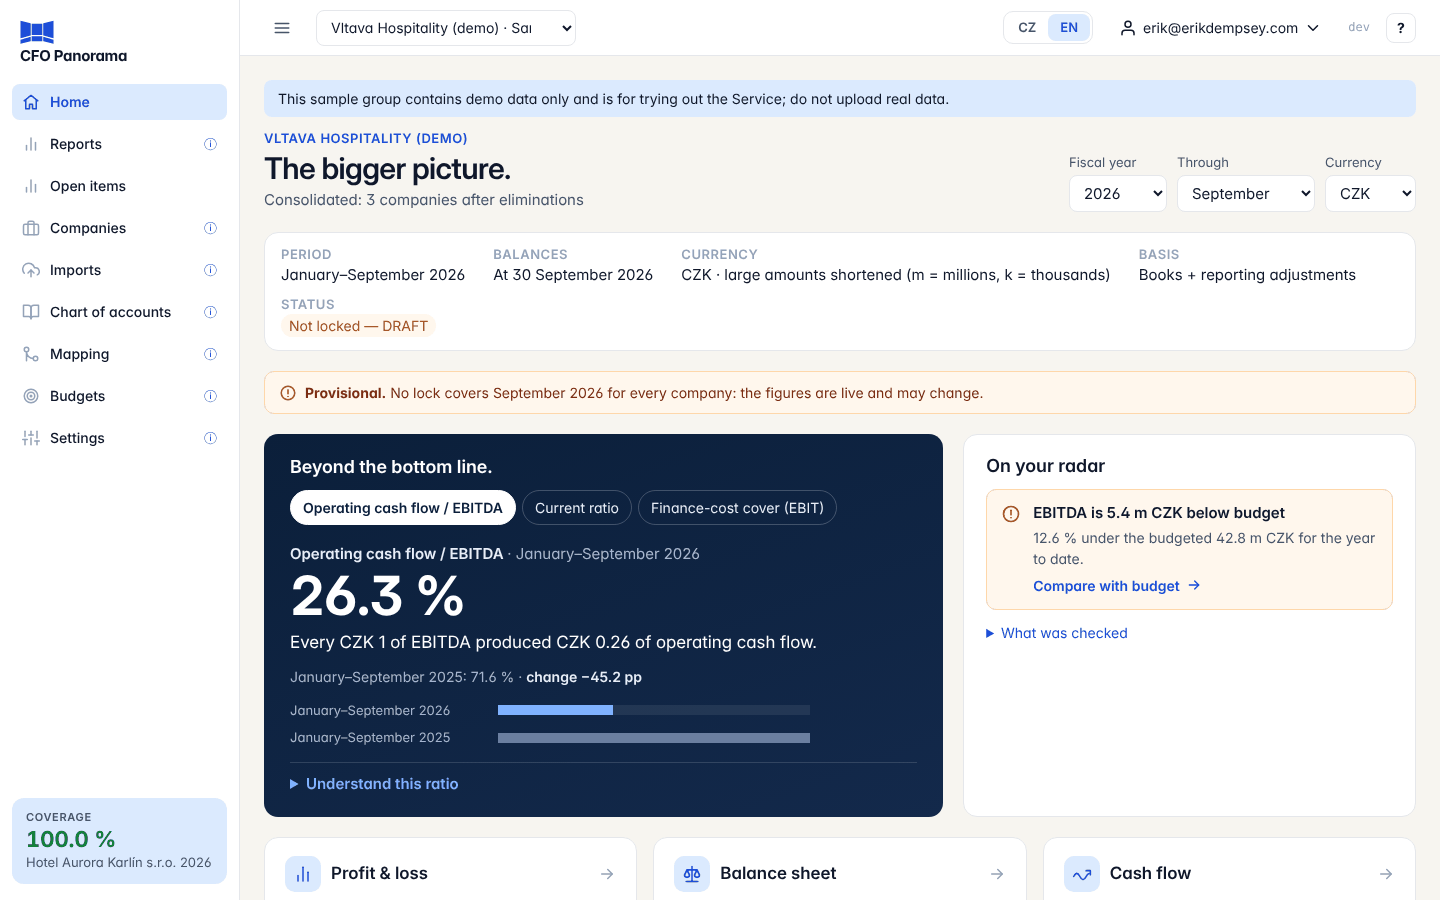
Home is the first page after you sign in: the bigger picture of your group, a company or a scope on one page. Every figure on it comes from the same report engine as Reports, so when you click a card, the report that opens shows the same numbers.
What Home shows
Home covers the companies you last chose on Reports: the whole group, one company, a scope or a set of companies. The line under the title says which, for example Consolidated: 3 companies after eliminations, One company or Sum of the selected companies, without eliminations. To change the selection, choose it on Reports and come back; Whole group next to the controls returns to the whole group.
Period and currency
At the top right:
- Fiscal year — the year shown.
- Through — the last month of the year to date. Home always shows the year to date, from the first month of the fiscal year to that month, compared with the same months one year earlier.
- Currency — CZK or EUR (ČNB rates), when the group reports in both.
The page updates as soon as you change a value.
Below the title, a short line sets out what you are looking at: Period, Balances (the balance-sheet date), Currency (large amounts shortened: m = millions, k = thousands), Basis (Books + reporting adjustments or Books only) and Status (locked or not). When a month is not locked for every company, a Provisional. note says that the figures are live and may change.
Beyond the bottom line — the spotlight
One ratio shown large, with the prior year beside it and a short sentence in plain words. Choose it with the tabs:
| Tab | What it measures |
|---|---|
| Operating cash flow / EBITDA | How much of EBITDA turned into operating cash (Every CZK 1 of EBITDA produced CZK 0.26 of operating cash flow) |
| Current ratio | Current assets ÷ current liabilities at the balance-sheet date |
| Finance-cost cover (EBIT) | EBIT ÷ finance costs for the year to date |
Your choice is remembered for the next visit. Understand this ratio opens the formula, the two figures behind it and its limits (Czech receivables and payables include VAT, so the current ratio is indicative), with a link to the report. A ratio that has no meaning (a negative or tiny EBITDA, say) shows n.m. with the reason.
On your radar
Up to three things worth a look, each with a link to the screen that deals with it:
- companies without figures for the year, or amounts not mapped yet;
- overdue receivables, from the latest open-items snapshot;
- EBITDA or revenue below the approved budget;
- proposed eliminations not posted, or intercompany pairs out of balance.
When nothing is found you see No significant exceptions found in what could be checked. What was checked lists what was assessed and what could not be (for example, no approved budget). The thresholds are fixed: 2 % of EBITDA (or 1 % of revenue when EBITDA is not positive), and budget differences of 5 % for EBITDA and 3 % for revenue.
The report tiles
Each tile opens its report for the same period, companies and currency.
| Tile | Figure shown | Opens |
|---|---|---|
| Profit & loss | EBITDA margin, against budget or last year | The P&L |
| Balance sheet | Net bank debt (or net cash), with cash and borrowings | The balance sheet |
| Cash flow | Free cash flow: operating cash flow less capital expenditure | The cash flow |
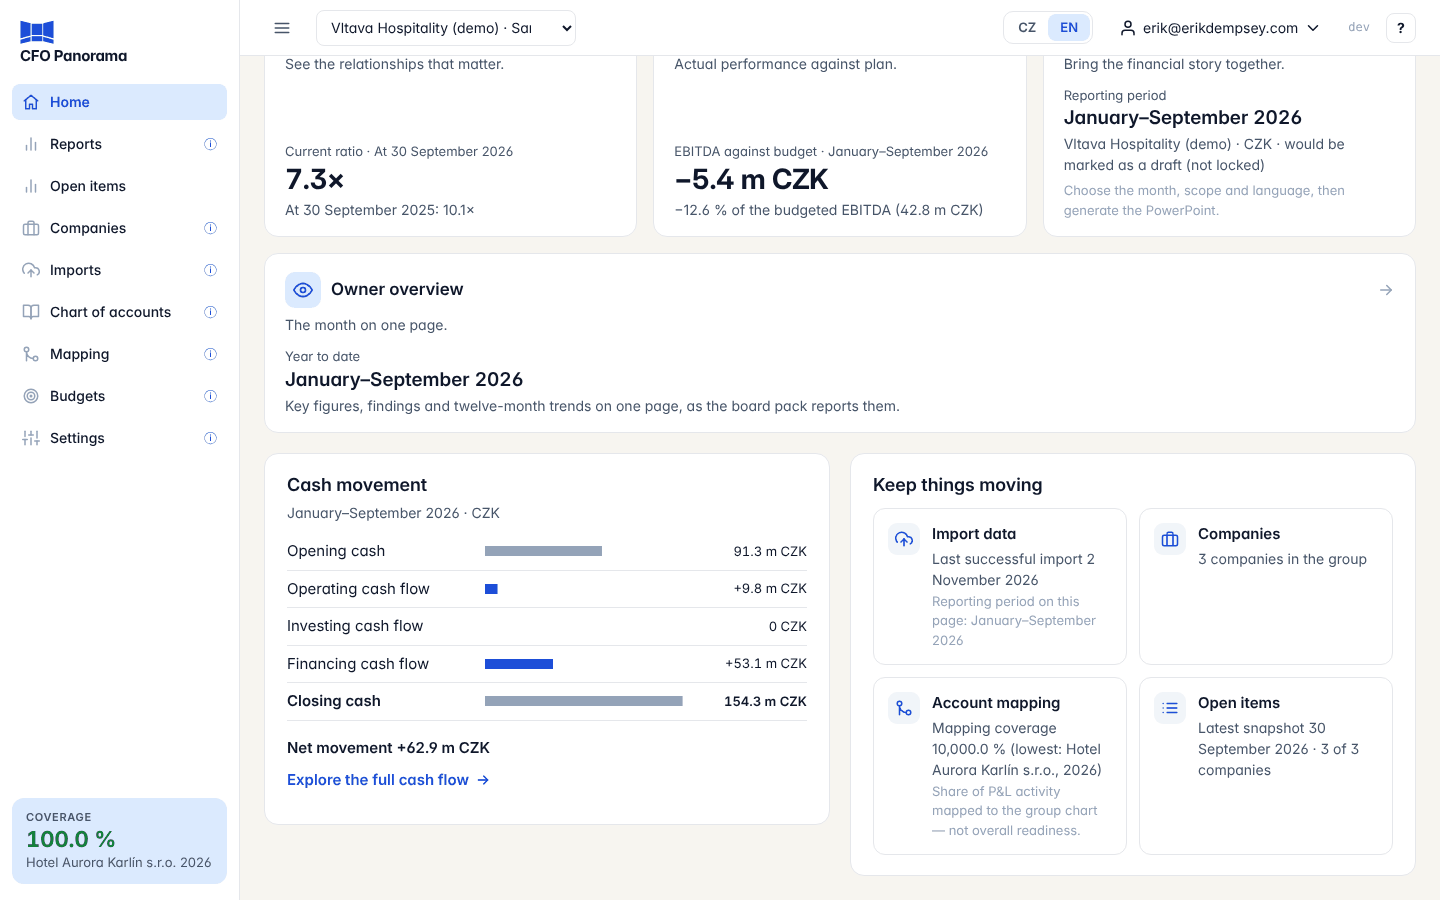
| Ratios & trends | Current ratio, against the same date last year | The Ratios tab |
| Budgets & plans | EBITDA against the approved budget | The P&L with the budget column |
| Board pack | The reporting period, scope and whether the pack would be a draft | Reports with the Board pack menu open |
| Owner overview | The month on one page | The owner overview |
Net bank debt counts bank loans, overdrafts and lease liabilities, less cash; shareholder and intercompany loans are left out. Without an approved budget, Budgets & plans says so. Board pack and Owner overview appear when the group's plan includes the board pack.
Cash movement
Opening cash, operating, investing and financing cash flow, any exchange-rate effect, and closing cash, as bars on one scale, with the net movement. If the cash flow does not reconcile to closing cash, the difference is shown as its own row, not hidden. Explore the full cash flow opens the cash flow statement.
Keep things moving
Shortcuts to the work around the reports. Admins and editors see Import data (with the date of the last successful import), Companies and Account mapping (with the mapping coverage); in a demo group viewers see Companies too. Everyone sees Open items with the date of the latest snapshot.
Good to know
- A card that cannot be calculated says so on its own; the other cards and the reports are unaffected.
- With no data imported yet, Home shows No figures yet and, for admins and editors, an Import data button.
Did not find what you need? Write to erik@cfopanorama.com.