Group structure
Who owns whom, as an interactive chart — pick a company, a holding with everything it owns or a saved scope, and open its report in one click.
On this page
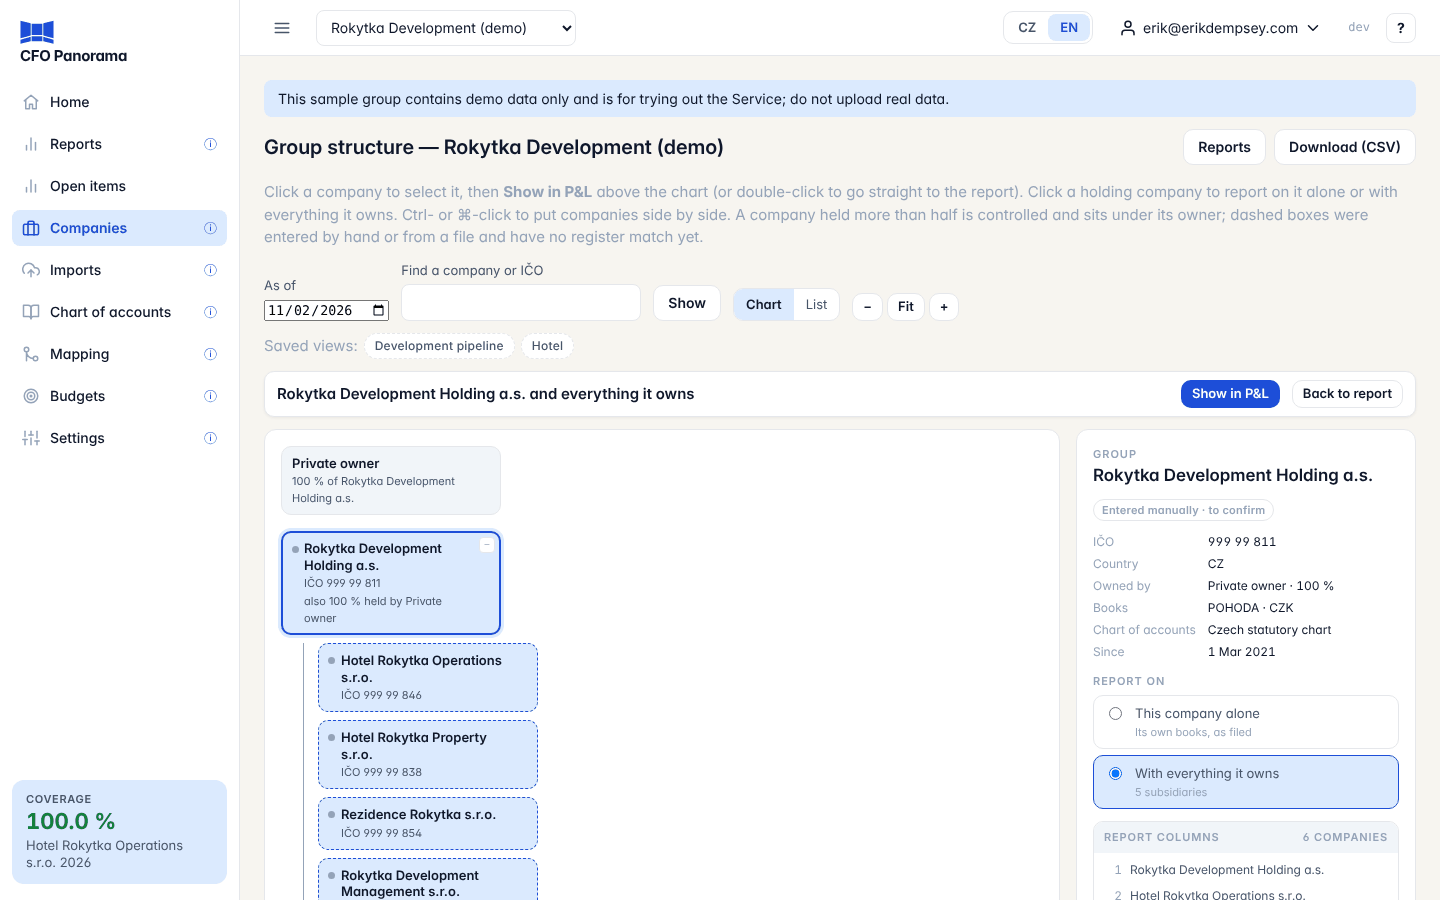
The Group structure page shows the ownership of the group as a chart: which company holds which, with what share and since when. It is also the quickest way to choose what to report on. Every member can use the chart; admins and editors also maintain the ownership links and the saved scopes below it.
Getting there
- in Reports, open Filters and click Choose from the group chart — the chart opens for the statement you were on (this is the way in for viewers), or
- Companies → Group structure (admins and editors).
Reading the chart
- A company held more than 50 % is controlled and sits under its owner. Smaller holdings are noted on the box (also 25 % held by …). Owners outside the group (people, funds, other companies) appear at the top.
- Each box shows the IČO and, where it is not 100 %, the share.
- A solid box matches the commercial register; a dashed box was entered by hand or loaded from a file and has no register match yet (Entered manually · to confirm).
- Coloured boxes show which saved legal scope a company falls under; the legend is under the chart.
Tools above the chart
| Tool | What it does |
|---|---|
| As of | The chart on any date — useful when companies joined or left the group. Click Show. |
| Find a company or IČO | Highlights the matches; Go to the first match jumps to it. |
| Chart / List | The tree as boxes or as an indented list (always a list on a narrow screen). |
| −, Fit, + | Zoom out, fit to the window, zoom in. |
| Saved views | One chip per saved scope; click to select it. A dashed chip is a management view. |
Select, then report
- Click a company. The side panel shows its details. For a holding, choose under Report on: This company alone (its own books, as filed) or With everything it owns.
- Ctrl- or ⌘-click more companies to put them side by side. Without a script, tick the boxes and click Show the ticked companies side by side. Side by side is not a consolidation: there are no eliminations.
- Check Report columns in the panel: the companies in chart order and the rows the report adds — Combined total for a selection, or Eliminations and the group or scope total where it consolidates. A company without imported data says no data yet.
- Report: the bar above the chart names your selection; click Show in P&L (or the statement you came from), or Open P&L / Balance sheet in the panel. Back to report returns to Reports without changing anything. Double-click a box to go straight to its report.
Scopes: legal and management
A scope is a saved selection you can report on, use in the board pack and close as one.
- Legal — a top company and everything it controls on the date of the report. It follows the ownership links automatically.
- Management — a fixed list of companies, whatever the ownership, for example "Hotel" or "Development pipeline".
A scope of two or more companies is consolidated: the report has its own Eliminations column (only the eliminations between its companies) and a "<scope> total" column. Balances with companies outside the scope stay as related parties.
Maintaining links and scopes
Ownership links
The Ownership links table lists each link: Company, Held by, Share %, From, To, Source and Note. Use Add a link:
- Company held — the company that is owned.
- Held by (group company), or leave — an outside holder — and type the name under or outside holder with its Holder kind (company, person, fund or other).
- Share %, From and, if the holding ended, To (empty = still held).
- Click Add link.
Edit changes the share, dates, note and Source; Delete removes a link. A company cannot own itself, a chain of ownership cannot loop back, and holdings in one company cannot exceed 100 % on any day — such a link is refused with a message.
Saved views (scopes)
Under Add a scope give it a Name, choose the Kind, then a Top company (legal) or the Members (management), and click Save the scope. The table shows how many companies each scope has today; Edit and Delete work per row.
Load from a file
Optional — for entering or changing many links at once; the forms above do the same one link at a time. Download (CSV) at the top writes the current links as group_structure_<group>.csv. The file's columns include company_ico, name, parent_ico, ownership (a fraction or a percentage), since and until (YYYY-MM-DD), and holder_name and holder_kind for an outside holder. Edit it, then under Load from a file choose it and click Upload and preview. The preview counts the rows to add, to change, unchanged, top companies and refused, with the reason for each refusal. Nothing is saved until you click Apply; refused rows are left out.
Did not find what you need? Write to erik@cfopanorama.com.