The Reports page
How the Reports page is laid out — the statement tabs, the Excel, Board pack and Filters buttons, the status chip, the statement table, Notes and Provenance.
On this page
Reports is where you read the figures: the P&L, the balance sheet, the cash flow and the ratios of one company, a scope or the whole group, for any period, in CZK or EUR. Every member of the group — admins, editors and viewers — can run reports, click through to the postings and download them.
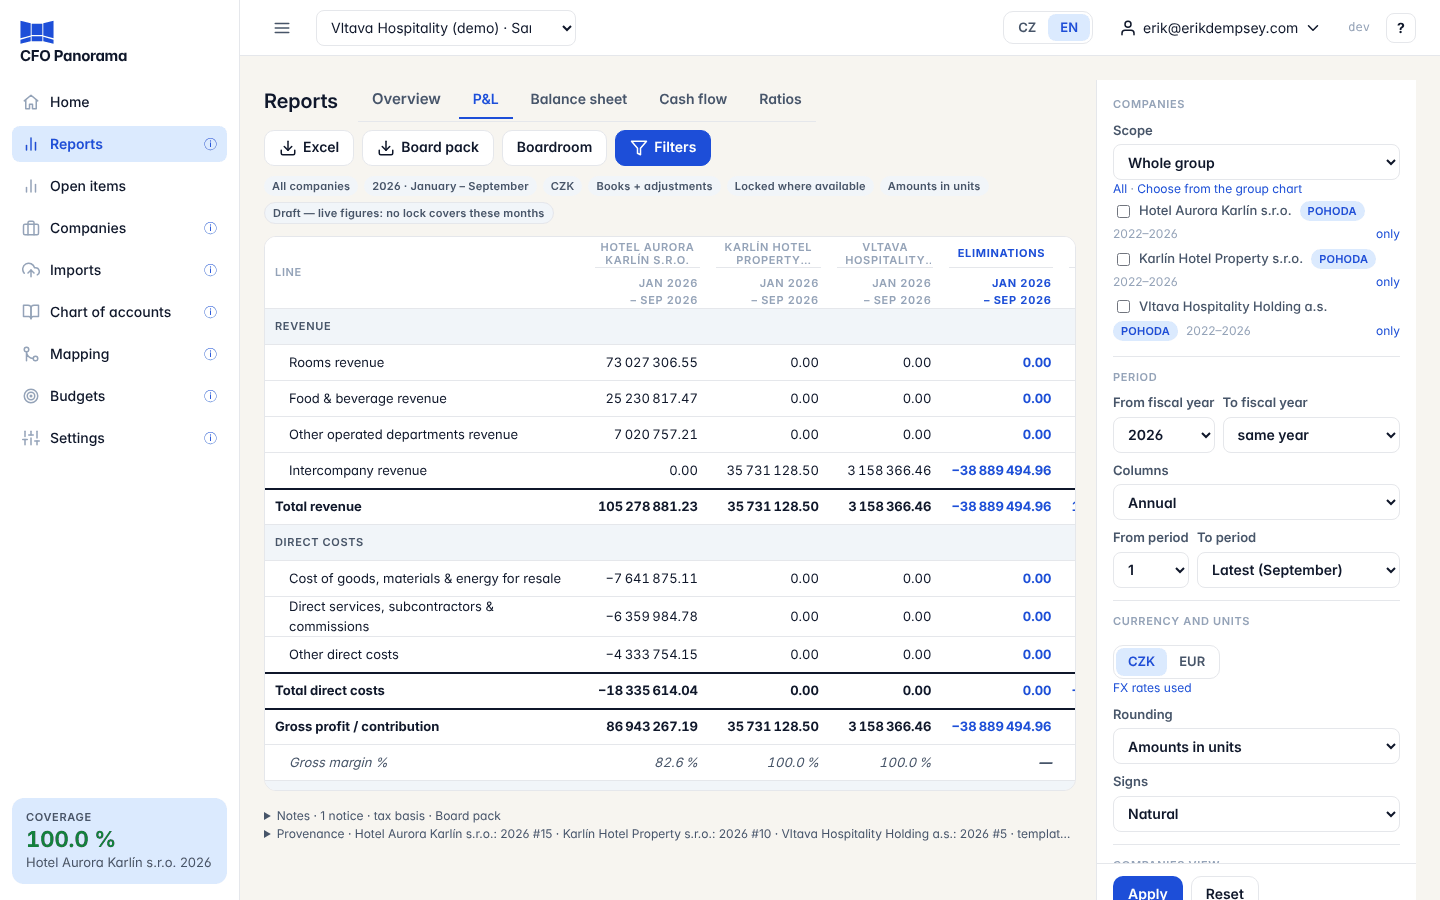
What you see
| Area | What it holds |
|---|---|
| Tabs | Overview, P&L, Balance sheet, Cash flow and Ratios. On Cash flow an Indirect / Direct switch sits beside the tabs (see The cash flow statement). |
| Buttons (right) | Excel, Board pack, Boardroom and Filters. The number on Filters counts the settings you changed from the defaults. |
| Summary chips | One line under the tabs that says what you are looking at: the companies, the period, the columns (for example Monthly), the currency, the basis, the data rule, the units and any comparison. |
| Status chip | The last chip says whether the figures are final (see below). |
| Statement table | The report itself. |
| Notes and Provenance | Two folded sections under the table. |
The Overview tab opens the owner overview, a one-page summary of the same selection.
The buttons
- Excel opens a small menu: Download workbook (one Excel file with every statement of the selection), This statement only and PDF. See Exports.
- Board pack builds the month's PowerPoint pack. See The board pack.
- Boardroom opens the same figures as a presentation for a meeting. See Boardroom.
- Filters shows or folds the filter panel. Every option is explained in Report filters.
The status chip
| Chip | Meaning |
|---|---|
| Locked snapshot (with its version, e.g. v1) | Every month shown is locked for every company: the figures will not change with a later import. |
| Draft — live figures: no lock covers these months | No month shown is locked yet; the figures follow each new import. |
| Mixed — locked in part; live: … | Some months are locked, others are not; the chip names what is still live. |
| Live figures — current data, not a locked snapshot | You chose Current under Filters → Data: you see today's books even where a lock exists. |
The statement table
- The headings name the company first and the period under it (for example Hotel Aurora Karlín s.r.o. over Jan 2026 – Sep 2026; a balance sheet shows its date, 30 Sep 2026). The consolidation columns Sum of companies (before eliminations), Eliminations and Group come last, shaded.
- The heading row and the line names stay in view while you scroll through a long statement or across many columns.
- Click any underlined figure to see what it is made of: the accounts and the journal lines. See Drill-down. On the balance sheet, the current-year result line opens the P&L year to date of the same selection.
- On the Ratios tab, click a ratio's name to see its formula and the figures used in every column. See Ratios.
- — means there is no figure (no data for that company or period). n.m. means not meaningful: a change or ratio whose base is zero, missing, negative or changes sign. Point at n.m. to see why.
Notes and Provenance
Under the table are two folded sections; click a title to open it.
- Notes collects everything worth knowing about the figures: the tax basis of the result line (for example that corporate income tax is not booked in interim months), the units of statistics, how a report in another currency was translated, months locked again as a new version, why a year has no Δ, and notices such as No lock covers September 2026. The title says what is inside, e.g. Notes · 1 notice · tax basis. Errors — when figures are incomplete or wrong — stay above the table, open.
- Provenance says where the figures come from: the latest journal export per company, the import batches, when the figures were built, the basis and the journals included, the locks, the exchange rates used and the mapping date.
Good to know
- Your filters are remembered. CFO Panorama keeps the last report you ran, per user and per group, on the server. Next time you open Reports — on any computer — you land on the same selection. Reset at the bottom of the filter panel forgets it and shows the defaults.
- A report is a link. The address in your browser carries the selection, so you can bookmark it or send it to a colleague in the same group.
- The way back. When you open a statement from the overview, the Boardroom or a drill-down, a button such as ← Back to the overview appears next to the page title.
Troubleshooting
- "No figures for this selection yet." The chosen companies have no data for that fiscal year; pick another year or company under Filters.
- "This group has no data yet." Nothing has been uploaded. Admins and editors start under Imports → Upload; see Uploading files.
Did not find what you need? Write to erik@cfopanorama.com.