The Boardroom
Walk the board through the month on screen — pages of figures, the evidence behind every number, and suggested questions with calculated answers.
On this page
The Boardroom shows the month's briefing on screen, page by page, so you can present it in a meeting and answer questions as they come. It uses exactly the figures of the board pack: nothing on a page is calculated separately, and every figure opens the evidence behind it. Every member of the group can use it.
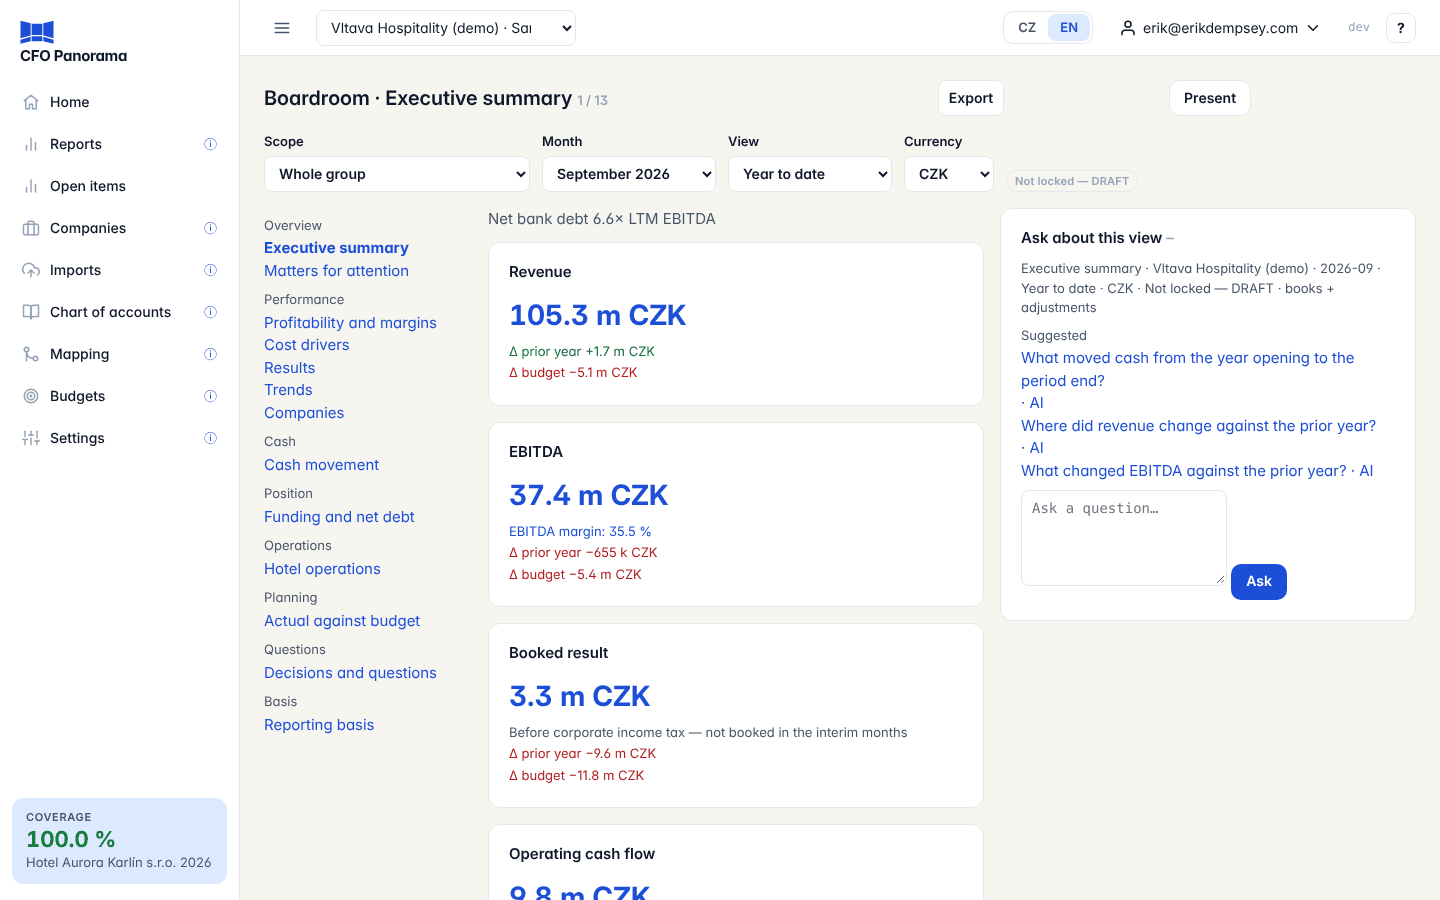
Opening the Boardroom
Click Boardroom at the top right of Reports, or Open in Boardroom on the Overview tab. The Boardroom starts from your current selection, or from the latest month with data, the year to date and the group's presentation currency.
At the top you choose:
- Scope — the whole group, a company or a saved scope.
- Month.
- View — Month, Quarter to date, Year to date or Last 12 months.
- Currency — when the group reports in more than one.
The chip beside them shows whether the figures are locked or a draft. The first time a month is opened it can take a few seconds to prepare; after that the pages open at once until the data changes.
The pages
The pages are listed on the left in sections, in reading order. A page that does not apply to your selection is not listed — for example Hotel operations for a group without hotels, Companies for a single company, or Actual against budget without an approved budget.
| Section | Pages |
|---|---|
| Overview | Executive summary, Matters for attention |
| Performance | Profitability and margins, Cost drivers, Results, Trends, Companies |
| Cash | Cash movement — VAT is shown apart: it moves cash but is not the business's own result |
| Position | Funding and net debt |
| Operations | Hotel operations |
| Planning | Actual against budget |
| Questions | Decisions and questions |
| Basis | Reporting basis |
Move with ◀ Previous and Next ▶ under the page, or with the ← and → keys. On a narrow screen the pages are a drop-down list.
Presenting
Present hides the page list, the selection and the panel so only the figures fill the screen. Leave presentation (or Esc) brings them back.
The evidence behind a figure
Click any figure — a tile, a table cell, or a bar of a chart — and the Evidence drawer opens. It goes down in levels, as far as the data allows:
- Calculation — how the figure is made from other figures.
- Report line — the actual, prior year and budget with their differences, and each company's own figure.
- Accounts — the Global accounts behind it, per company.
Under it, Journal lines (opens the drill-down) opens the postings and Open in Reports opens the same figure in the report workspace. Both bring you back with Back to Boardroom. Where a level does not exist the drawer says why, for example Budget: no source transactions or Imported as balances: no journal lines for this year.
Ask about this view
The panel on the right is headed with the context of the page: page, scope, period, view, currency, lock state and basis.
- Suggested lists up to three questions that fit the page, such as What changed EBITDA against the prior year? Click one to get a Calculated explanation (no AI): an answer built from the page's figures by the application itself, with links to each figure it uses and a next drill-down.
- You can also type your own question and click Ask. Answers phrased by an AI model are currently available on demo groups only; elsewhere the panel says Model answers are not switched on for this group, and the suggested questions give the calculated explanations. A model answer is checked against the figures before it is shown; if it does not pass, you get the calculated explanation instead.
- Causes are never claimed: the answers say what the figures show, not why.
Questions and answers stay in your session for up to 24 hours. An answer given on another page is dimmed and labelled, and one given on figures that have changed since is marked so. Your questions are kept only in your session, not with the group's data.
Export
Export at the top offers the same selection as files: Executive deck and Board pack (PowerPoint), Excel workbook and PDF statements. The PowerPoint stays the document to send or keep; the Boardroom is for working through it together. See The board pack and Excel and PDF exports.
Troubleshooting
- "There is no data to show yet" — no company of the group has imported books yet.
- A page you expect is missing — it does not apply to the selection (no budget, one company, no hotel); change the scope or month.
Did not find what you need? Write to erik@cfopanorama.com.